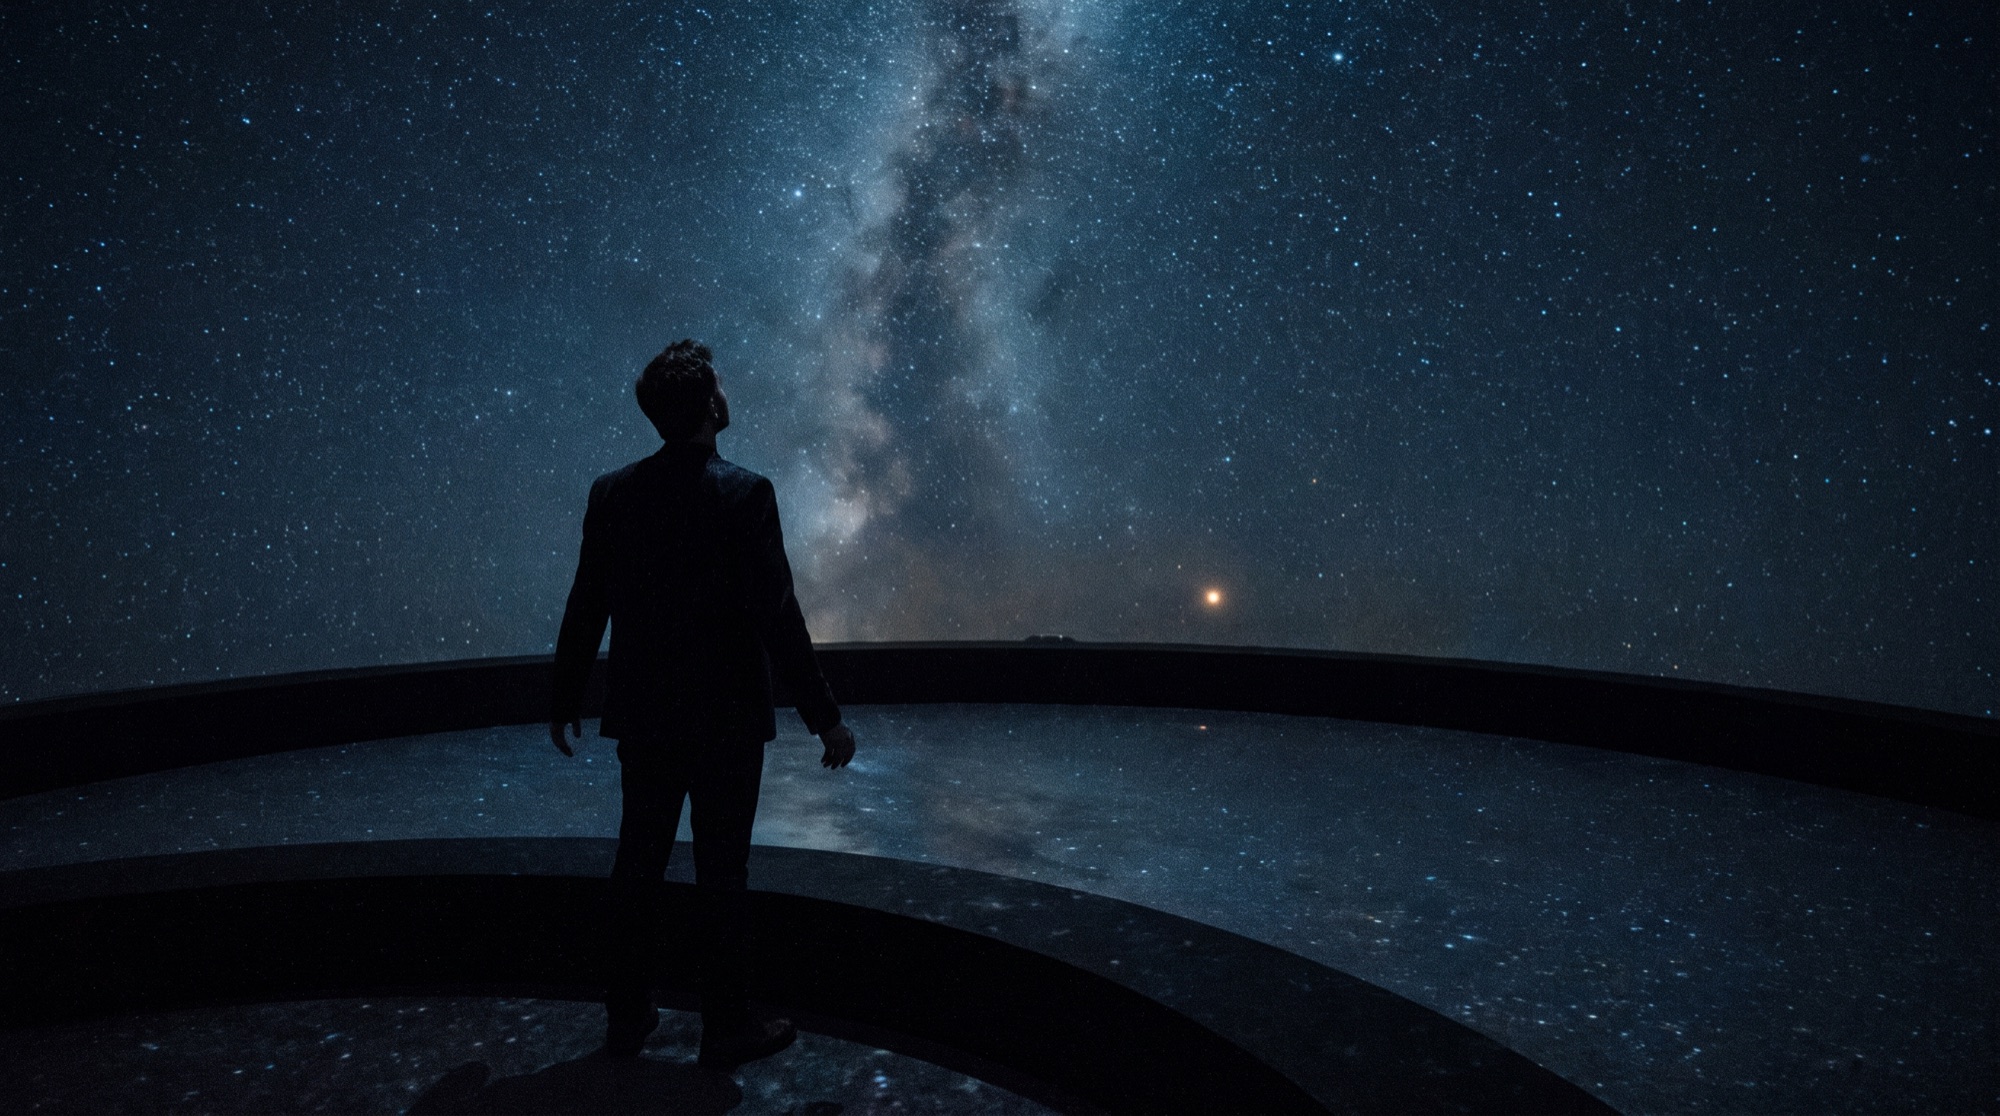
There is a scene in the movie Passengers where Jim Preston, played by Chris Pratt, stands alone in a dark room while the ship’s computer projects the galaxy around him. Not a screen he looks at. A space he is inside.
That stayed with me. Of course many of the stars near us have been cataloged. What I didn’t know was how many, or whether anyone had built the version you could move around in, like in the movie.
Most of what I build with AI is commercial: products, and automation for the parts of running a small company that nobody should still be doing by hand. But every so often it seems worth pointing it at something with no commercial purpose at all, just to see what happens (the scientific method: fuck around and find out). This one started after reading Ethan Mollick’s account of having an LLM build a working isochrone map of travel times, the kind of map first drawn in 1881 (What it feels like to work with Mythos). His point was that no earlier model could do it at all, because the job is thousands of small research decisions rather than one clever answer. He published that on the ninth of June. Neither Mollick nor I got to work with Mythos itself, as it turns out. He had early access to Fable, its slightly less alarming twin: the same brain with the safety measures switched on, and the one people like me are allowed to have. The map was built with something more ordinary still, Opus, which was what I had in June. It got me thinking: point an LLM at a similar task, but with much greater distances. I started building this shortly after. The result is at intuslogic.com/stars, if you would rather see it first and read about it after.
The catalog
It turns out the answer to my first question is yes, and it has been yes for a long time.
The data comes from the HYG Database, version 4.1, compiled by Astronexus from the Hipparcos, Yale Bright Star and Gliese catalogs with Gaia’s parallax measurements folded in. It’s free. It’s released under a Creative Commons license. And it has been sitting there for years.
It is also 119,626 stars across 37 columns.
Here is one of them, exactly as it appears in the file:
46999,47132,,,"","","",9.604318,34.017169,401.6064,12.53,
-22.92,0.0,8.62,0.601,K0,1.0,-269.526194,195.357062,
224.675208,-0.00003453,-0.0000051,-0.00003699,...
That is one star. There are 119,625 more.
It is a K-type star about 1,310 light years away, in Leo Minor, and it does not have a name. It has a number, HIP 47132, from the Hipparcos catalog. That is not unusual. Of the 119,626 stars in the file, only 465 have names. Everything else is a number in somebody’s ledger. Inside the fifty light year box I ended up building, it is 66 out of 981.
I did try reading it. If you printed just the columns that identify a star and say where it is, you would be looking at something like 2,600 pages, and a single row will not fit across one printed line. Here are about forty rows from the middle of the file. Notice the column headed “proper,” which is where a name would go. In those rows, it is empty the whole way down.
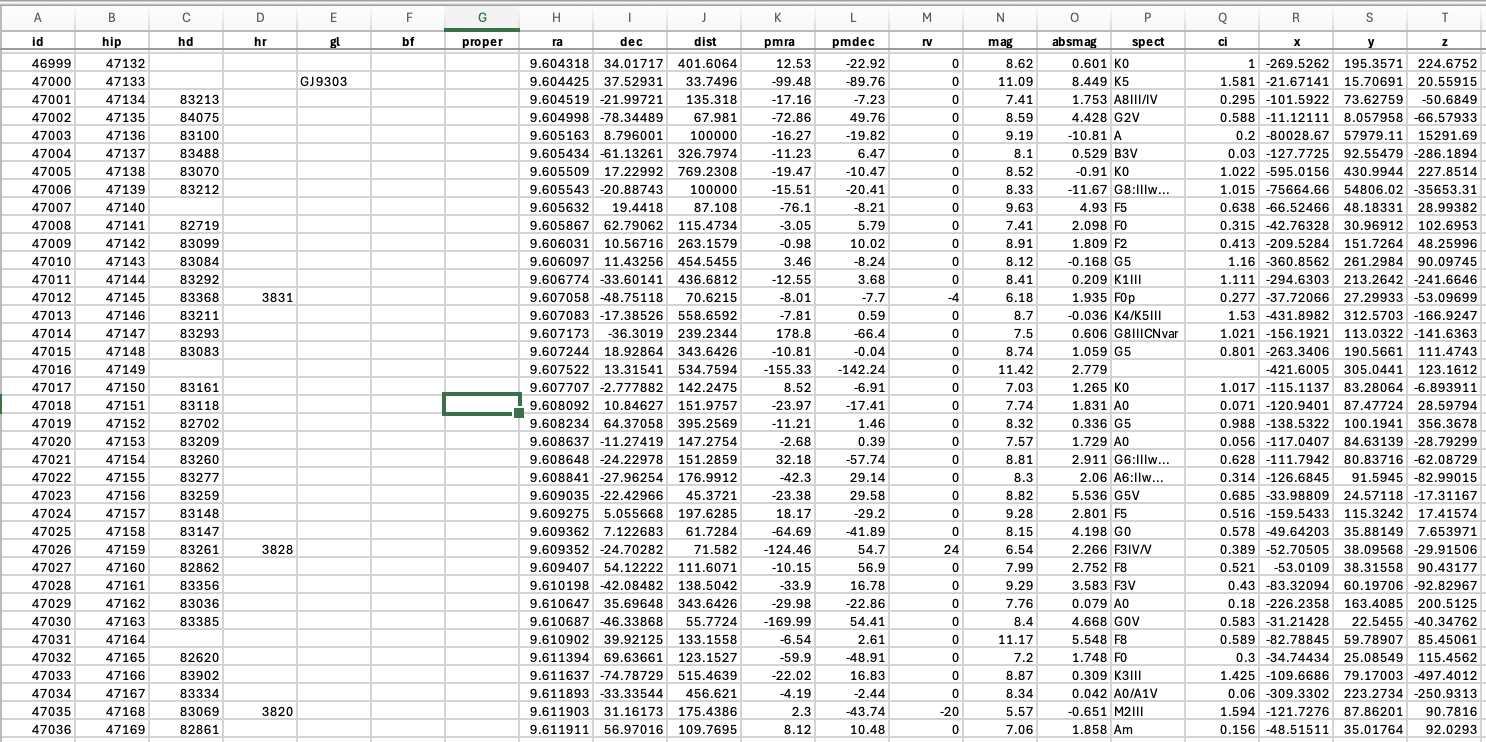
None of this is a complaint about the data. The data is outstanding, and free, and the product of two centuries of extremely careful work. The problem is somewhere else.
You cannot hold a table of numbers in your head as a shape.
What was in column twenty
Once I had something I could move around in, the first thing I did was look for the nearest star, because that seemed like the obvious place to start.
It was not where I expected to find it.
Proxima Centauri is 4.23 light years away, which I knew. What I had never registered is the direction. Nearly all of that distance is down. Not down toward the floor, and not below the horizon. Down relative to the plane the map is built on, which is Earth’s equator extended outward into space. We inherit a flat intuition from star charts and classroom lectures, but the universe does not actually work that way.
I can be more precise than that, because the number is right there in the file. Proxima is on row 70,667 of 119,627. The file is sorted by position on the sky, not by distance, so the nearest star to us sits more than halfway down, between two stars nobody has named, one of them 311 light years away and the other 1,240. Its position is given as three coordinates, and the third one, the vertical one, reads:
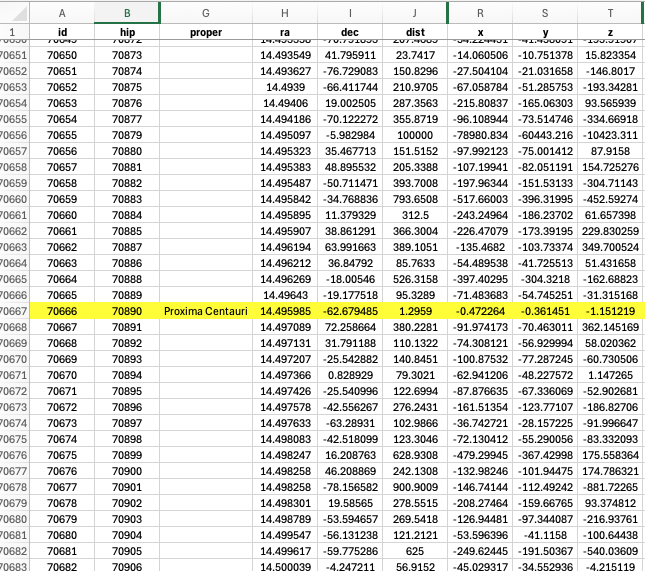
z = -1.151219That is in parsecs. Converted, it is 3.755 light years of the total 4.23 light years. Eighty-nine percent of the distance to the nearest star is straight down, toward the south celestial pole. Proxima is not out there on its own, either. It is the third member of a triple star system, and the other two, Rigil Kentaurus and Toliman, sit at eighty-seven percent. The whole system is down there together.
There is a more local way to feel it. From West Palm Beach, where I live, the nearest star is never really up. At its very best it grazes the southern horizon. The rest of the time you would have to point through the Earth.
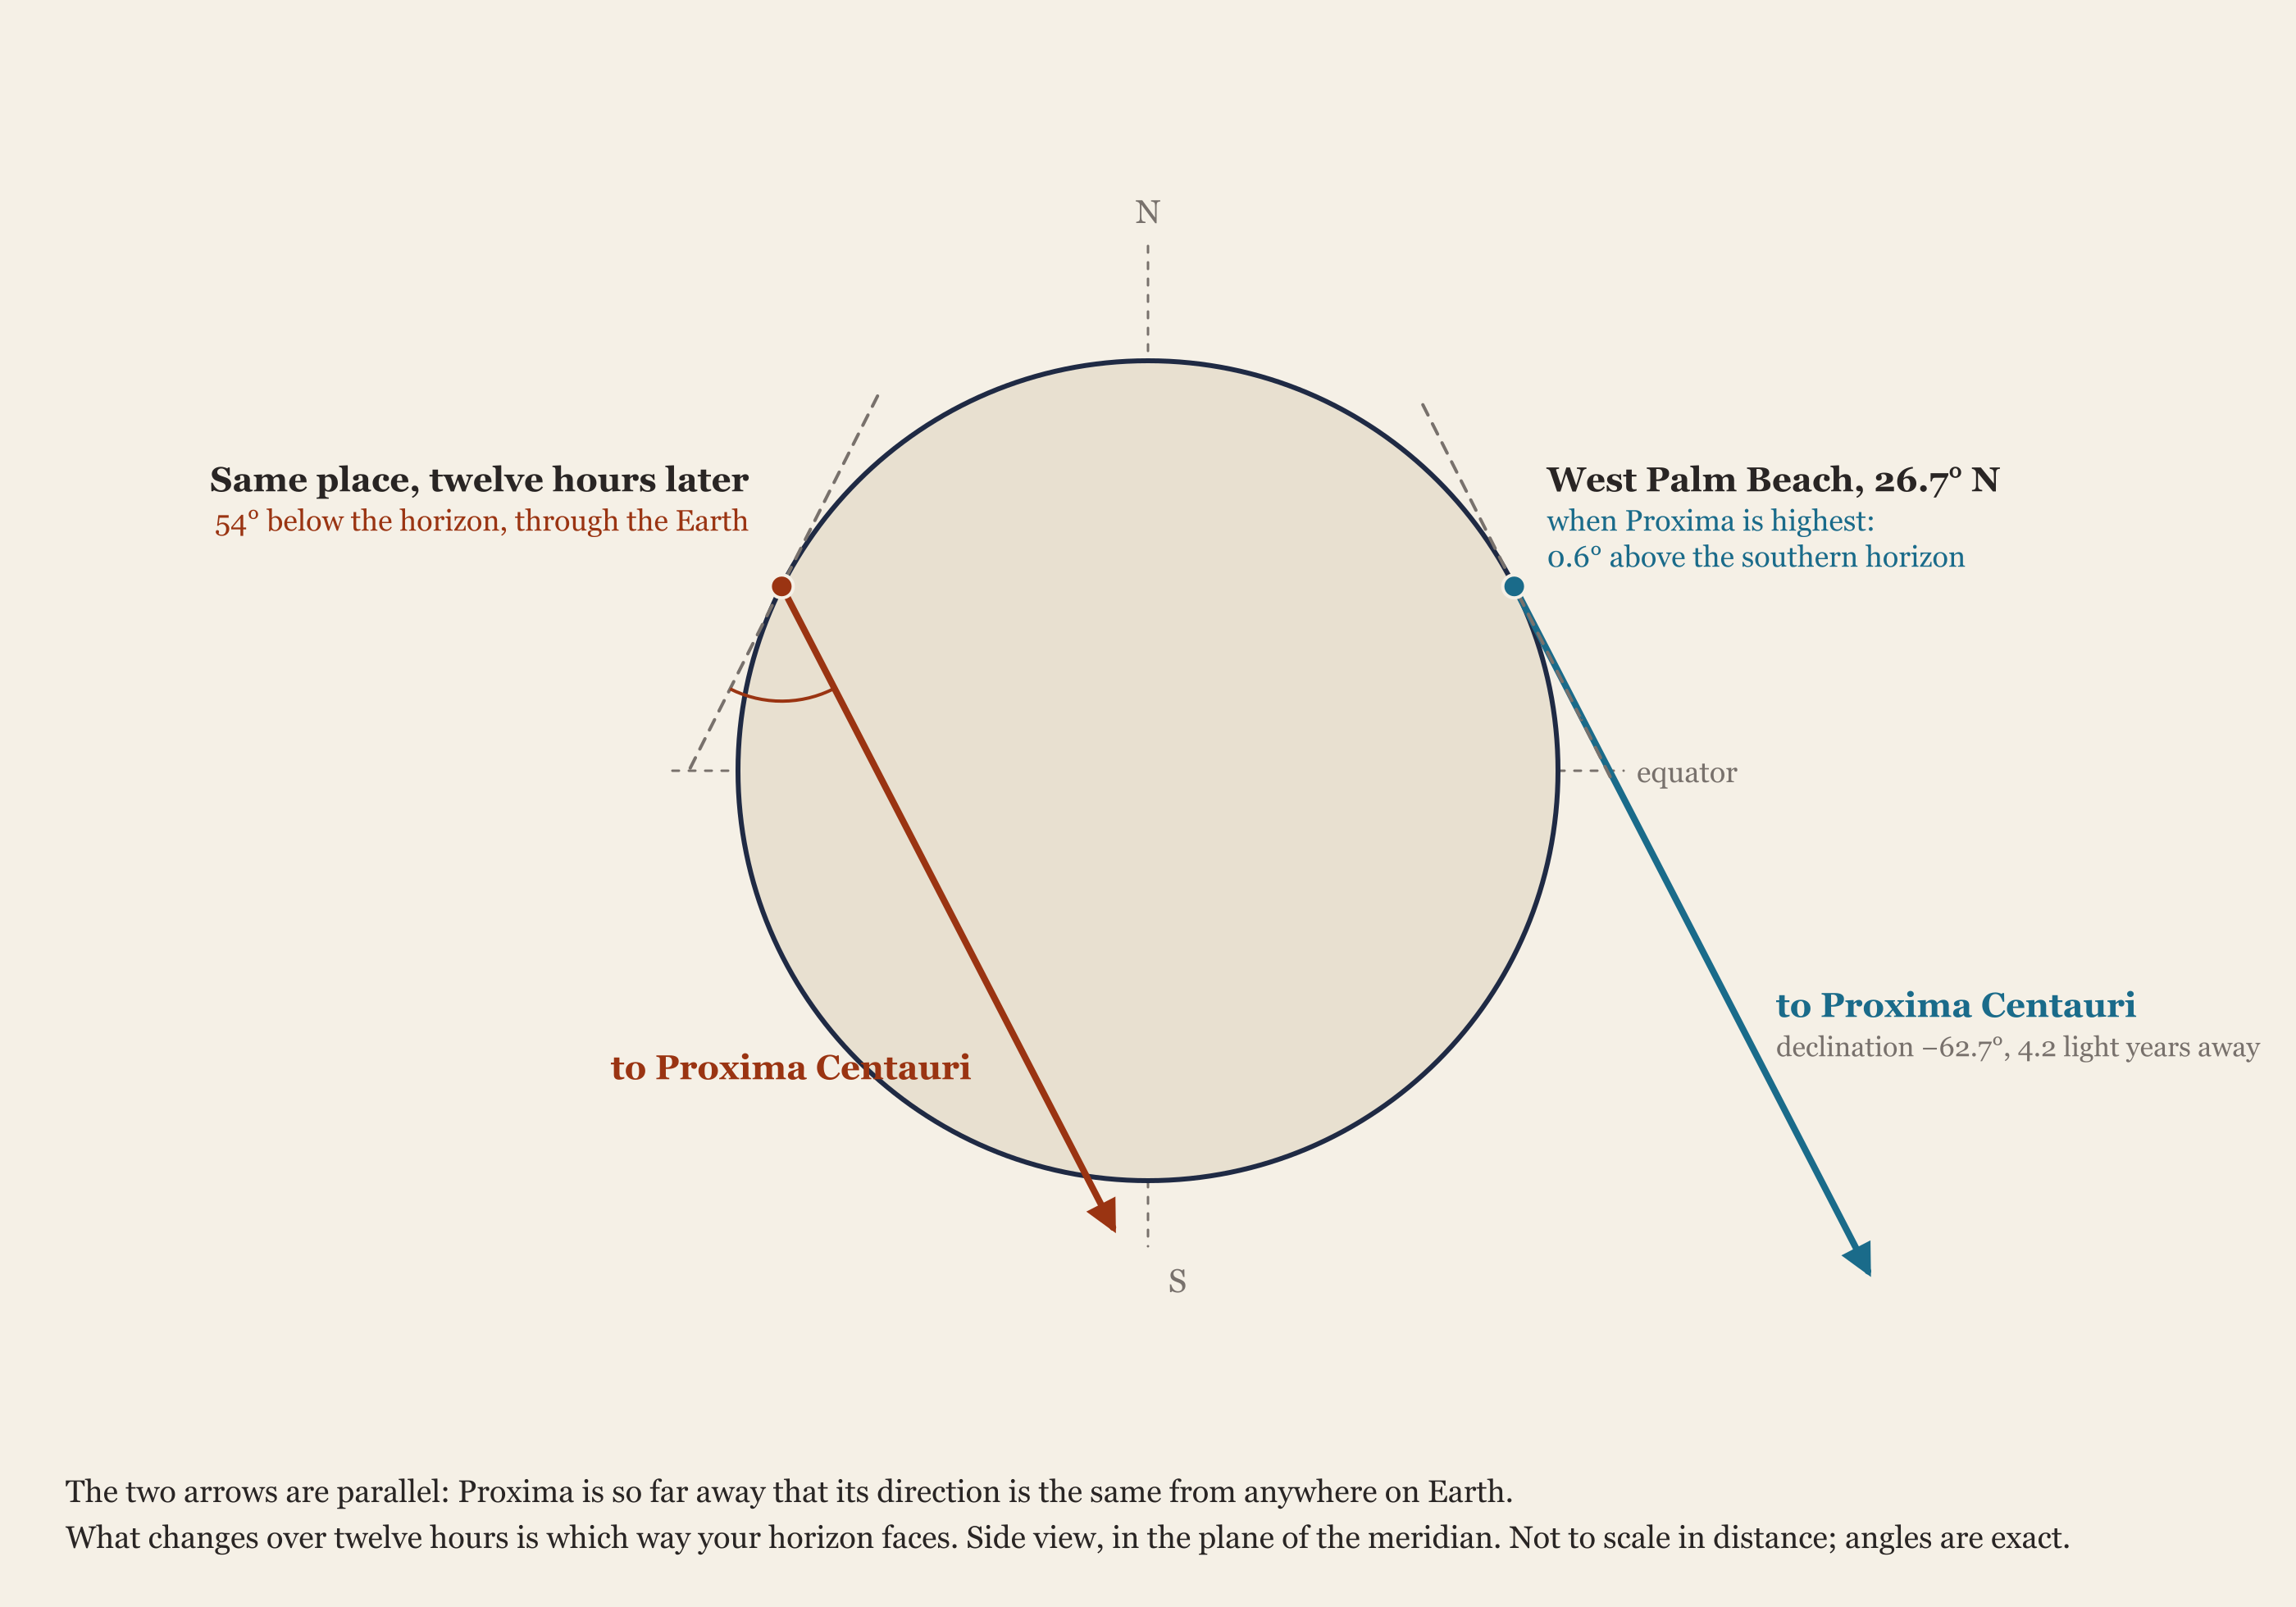
Column twenty of thirty-seven. Not hidden, not missing, not behind a paywall. It had been sitting in a free file the entire time, and I had never once seen it.
You can look yourself. The map is here, and it works on a phone. Find the Sun in the middle and look down.
What that distance actually is
The number by itself does nothing. I needed a way to feel it.
The one that has always worked for me is a golf ball. Shrink the Sun down to a regulation golf ball, 1.68 inches across, and set it on the floor of my living room here in West Palm Beach. At that scale the Earth is a grain of sand about a sixtieth of an inch across, sitting fifteen feet away. Everything that has ever happened to our species happened on that grain.

So where does the next golf ball go, the one that represents Proxima Centauri?
I remembered reading that it lands somewhere around Atlanta. When I actually did the math it came out further than that. It is 766 miles, which puts it in Nashville. Atlanta is 551, so whoever I read was probably measuring driving distance, where Atlanta is defensible.
Ask a hundred people to place that second golf ball and most of them will say across the room, or across town. Nobody says two states away.
Here is the same distance measured in time instead. The Voyager 1 spacecraft left Earth in 1977 and is the most distant object we have ever made, moving away from us at about 38,000 miles an hour. At that speed a single light year takes it roughly 17,600 years. Reaching Proxima would take about 75,000 years. Crossing fifty light years would take about 880,000 years, and Voyager has now been flying for forty-nine years, which is somewhere near 1/18,000 of the trip.
Within fifty light years of the Sun there are 981 stars, in every direction, and almost none of them have names.
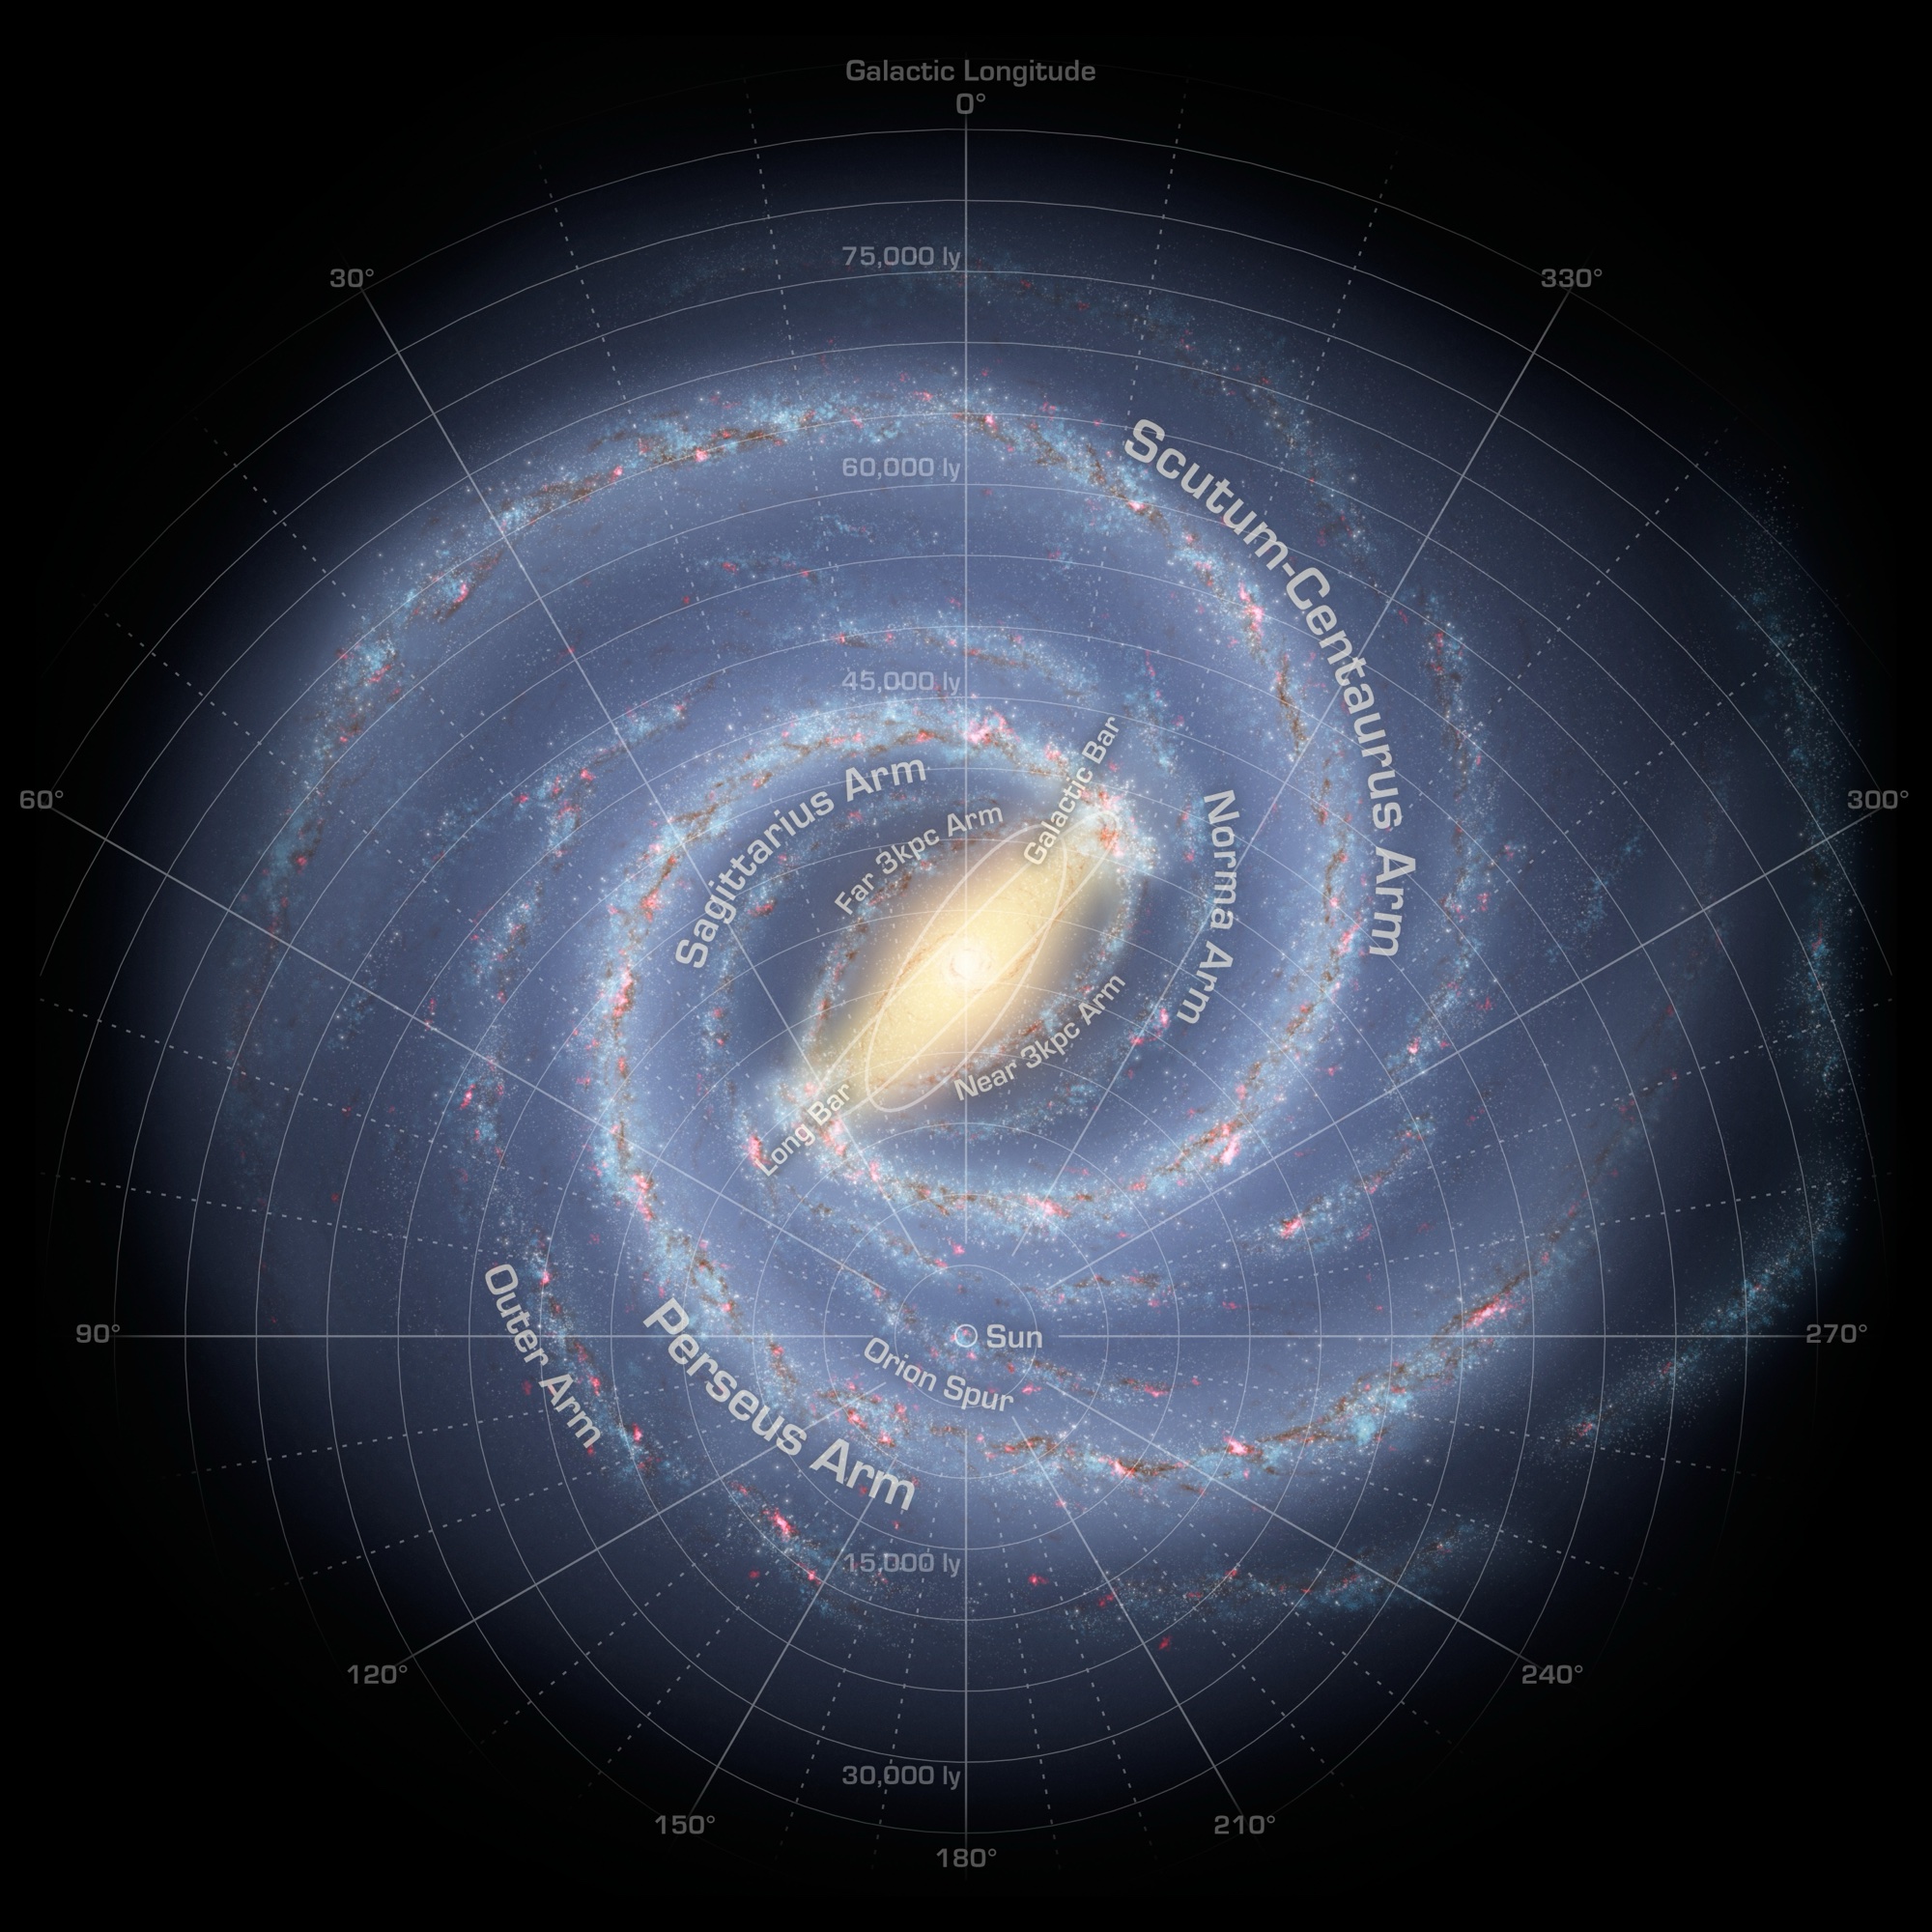
To give you a sense of the scale, imagine it like this. Set against the galaxy alone, everything within fifty light years of the Sun is a dot about four pixels wide on NASA’s picture of it, or, as water, about a quarter of a drop in a full bathtub. Now take all the water in Earth’s oceans and let it stand in for the observable universe. The same fifty light years, all 981 star systems, the golf ball and the grain of sand and the 880,000 years, comes to somewhere around one thirtieth of a single drop, depending on how big you think a drop is.
So in cosmic terms, Proxima Centauri, seventy-five thousand years away at Voyager’s speed, is the townhouse next door.
How anyone knows any of this
There is a fair question buried under all of that, which is how we know any of these distances in the first place. You cannot pace them out. Nothing has ever been there.
The answer arrived remarkably late. In 1838, at Königsberg, Friedrich Bessel spent months watching a single unremarkable star in Cygnus, chosen because it moved across the sky faster than its neighbors, which suggested it might be close. What he was looking for was a wobble: the tiny shift in the star’s apparent position as the Earth swung from one side of its orbit to the other.
He measured about a third of an arcsecond. That is roughly the angle a US quarter would make if you looked at it from ten miles away.
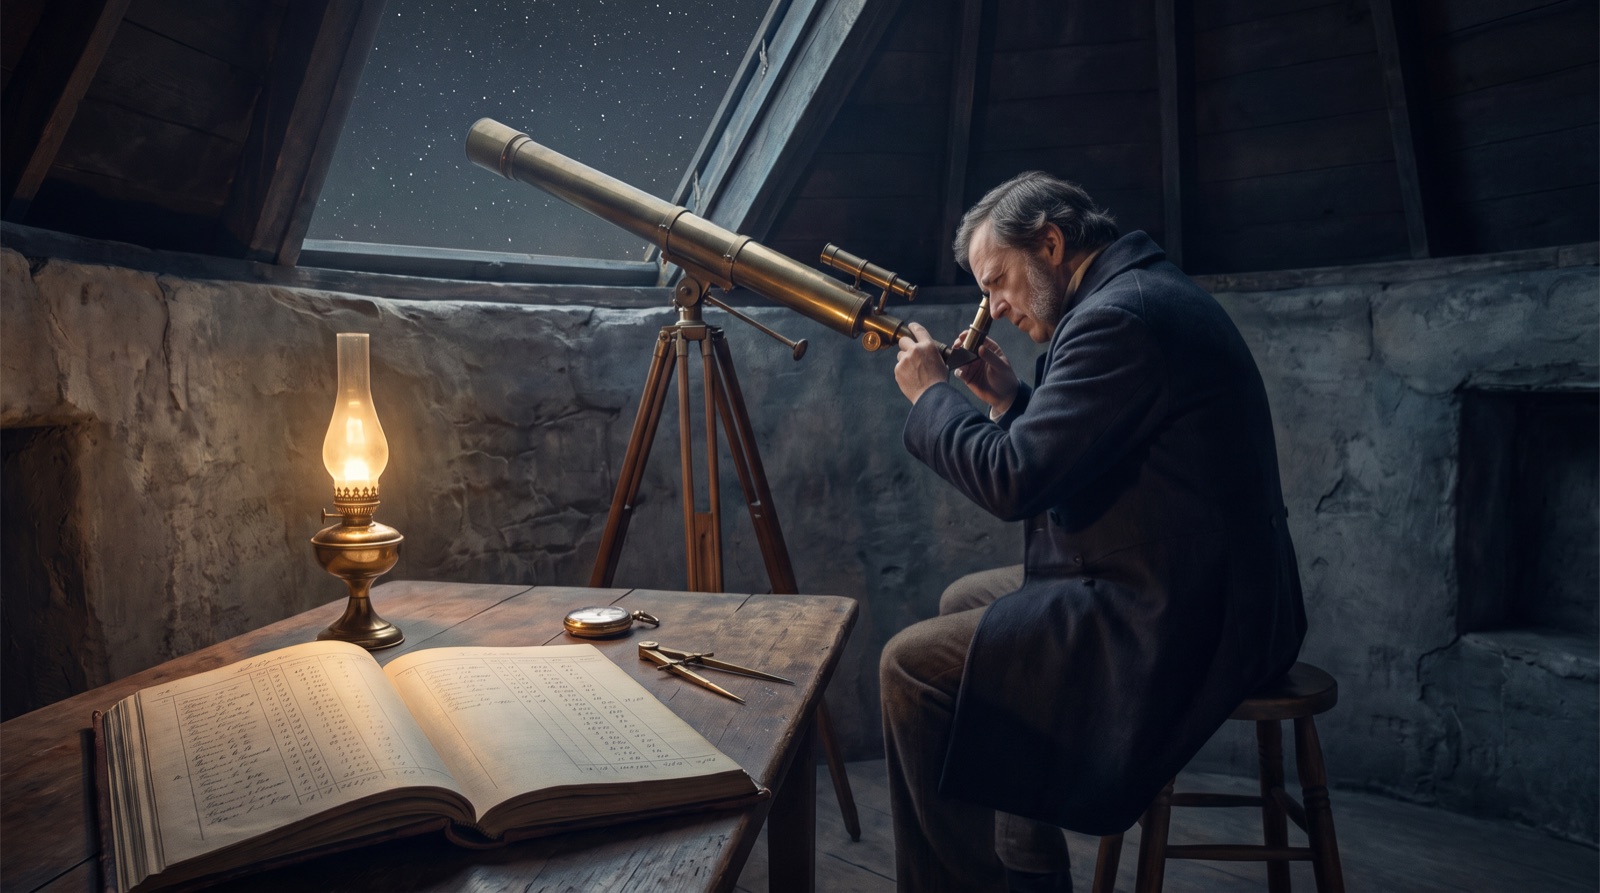
From that one number he calculated a distance of around eleven light years, and in doing so became the first human being to know how far away any star is. Not Copernicus. Not Galileo. Not Newton. Every one of them lived and died without that number. Thomas Henderson and Wilhelm Struve were working the same problem at nearly the same moment, so it was close, but the point stands: we have known the distance to another star for less than two hundred years.
And it stayed hard. Only a few dozen more parallaxes were measured in the remainder of the nineteenth century, each one a serious piece of a career.
Then the Hipparcos mission launched in 1989 and brought back about a hundred thousand of them. Then Gaia, launched in 2013, which has measured more than a billion.
Two centuries of painstaking, career-length work turned into a file whose download took under a minute.
How I actually built it
I want to be careful here, because this is the part where these essays usually turn into a sales pitch. So I went back and read the transcript.
The map took seven prompts from me. Two of them were the word yes. What follows are my actual prompts, dictated, lightly cleaned up for grammar, with nothing about the substance changed. The first one is the entire specification:
I have another idea that I’ve often thought about but don’t know if the data exists to make it work. And that is having a three dimensional square that is 10 light years in each direction, with our solar system at the center, and you could use your mouse to move through that space to see what else is around there.
A three dimensional square. I meant cube. I did not name a catalog, a coordinate system, or a programming language, because I did not know any of them. I did not know whether the data existed. I described standing inside something and looking around, and I described it badly.
The reply began: “Short answer: yes, the data absolutely exists and it’s very good.” Then it told me something I would not have thought to ask. A box ten light years across contains almost nothing but the Alpha Centauri system, because space is emptier than people expect, so it made the box adjustable and set it wider. It built a first version from about thirty stars it knew from memory, said so plainly under a heading it titled Honest caveats, and offered to pull the real catalog if I wanted the rest.
My next message was the discovery, typed in the moment:
That’s very interesting! I did not realize that Alpha Centauri is actually about four light years directly down from the sun, not out from the sun.
Then I said yes to the real catalog, and 981 stars arrived. Then I asked whether I could fly through it, and it built the tour. Then I said yes to something else it suggested. That was the map.
Here is what it knew that I did not, in the order it told me. That the data existed, and which catalogs held it. That a ten light year box would be essentially empty. That the vertical line under each star was the thing that would make a flat screen read as depth. That the catalog it pulled would be short by roughly half, and that the missing half was faint red and brown dwarfs, which are hard to detect. That last one it volunteered when it loaded 981 stars against its own estimate of about two thousand.
And here is what it got wrong, because a section like this is worthless without it. It read my ten light years in each direction as a cube ten light years across, half what I meant, and the selector it built measured the box by its edge while I have always thought of it by its reach. The picture looked right, so neither of us noticed. I found it two months later, while writing this, when the count of stars in the box would not match the count in the essay.
I did not discover a technique. I was forced into the right posture by not knowing enough to do it wrong. But having watched it work, I think the posture is this, and I suspect it holds for working with an LLM on almost anything: describe the outcome, judge the result, and correct at the level of the result rather than the method. I never once told it how to do anything. I told it what I wanted to see, and when I could not see it, I said so.
That is not a trick that only works on side projects, and it is not specific to star maps. So far it has held on the commercial products and the office automation too. An AI will do pretty much exactly what you tell it to do, which sounds like a virtue and is also the trap. Tell it how, and you get the how, faithfully, whether or not the how produces the thing you wanted. Tell it what, look hard at what comes back, and say what is still wrong, and you are iterating on the outcome instead of on your own instructions. Constraints still matter, and I give plenty: what it must not touch, what the result has to meet, what would make me reject it. But the method is the part I have learned to leave alone (mostly).
The people I watch struggle with this are usually the ones who know the most. They specify the process, because they can, and they get exactly the process they specified. I could not have specified anything. It turned out to be an advantage, which is a strange thing to admit and probably the most useful sentence in this essay.
Why fifty, and what the box leaves out
I picked fifty light years more or less at random. While writing this I wondered whether the box should be bigger, since the catalog goes so much further, so I went back to the file and counted.
Out to fifty light years, about a third of the stars in the catalog are the small red ones astronomers call M dwarfs. Out to 250, it is eight percent. Out to 500, three and a half. That is backwards. In reality something like seven in ten stars anywhere are M dwarfs. They are just faint, and past a certain distance the surveys stop seeing them. Beyond about 150 light years the count of faint stars in the file barely moves while the total quadruples. The typical star in a 250 light year box is roughly 250 times brighter than the typical star in a fifty light year box, and that is a fact about telescopes, not about space.
So a bigger box would look more impressive and be less true. It would be a map of what we can detect rather than what is there. Fifty turned out to be about where the catalog is still describing the neighborhood instead of the instrument. I kept it, and I stopped thinking of the number as random.
The same arithmetic says something about the box I did keep. If a third of my stars are M dwarfs and the real share is closer to seven in ten, then roughly half the stars within fifty light years are missing from the map. Nine hundred and eighty-one is a floor, not a census, and the true number is probably nearer two thousand. Which is, I noticed later, almost exactly what the model estimated in its first reply, before it had loaded the file.
One more thing about that file. Between the version I built from and the one released since, the count of stars within fifty light years did not change by one. What changed is that thirty-four more of them were given names.
I should also say plainly that none of this is new as software. Celestia, Stellarium and SpaceEngine have drawn the sky in three dimensions, beautifully, for years, and if you want a star map you should download one of them. They are far better than mine. They are also products, designed by other people, answering the questions their designers thought to anticipate. What is new is not the map. It is who can make one. A bespoke instrument for one person’s specific question, built in a weekend by someone who could not name a single catalog, used to require a specialist sitting between the question and the data. It does not any more.
Whose map it is
The measurement belongs to Bessel, and to Hipparcos, and to Gaia. Two centuries of people spending careers to find out how far away things are, and the download itself took under a minute. Everything after that took longer. I want to be exact about what I contributed, which is the interface. I made it possible for one person to stand inside the numbers, and standing inside them is how I noticed the thing that had been in column twenty all along.
When I wrote about AI last month I ended by saying that the limit on what a person can do is no longer their budget or their background, but their imagination. I believed it when I wrote it. This is what it looks like as an object. The measuring is still hard, and it is still being done by far smarter people than me with instruments I will never see. What collapsed to hours is the part between the measurement and the person who wants to look at it.
That is also, as it happens, most of what I enjoy doing for work now: build the specific instrument for the specific question, for people who have the question and not the tool.
The map is at intuslogic.com/stars. It works on a phone now. There is a button to zoom out to the whole galaxy, and another to take the tour, which flies you through the field so the near stars sweep past and the far ones drift. Proxima is easy to find. Look down.
With a good LLM and some imagination, there is a lot less you can’t do than there used to be.
When I closed the laptop that afternoon in June, I remember thinking two things. That this was genuinely cool. And that there was almost certainly no market for it whatsoever.